When enterprises begin migrating from SAS to a lakehouse platform like Snowflake or Databricks, the most common question is: "Where do we start?" The answer begins with understanding the scope of the challenge. SAS codebases tend to rely heavily on a surprisingly small set of procedures. In most organizations, just 20 procedures account for over 90% of all PROC calls. That sounds manageable — until you realize each one carries behavioral nuances, implicit defaults, and edge cases that make simple syntax mapping a recipe for silent data errors.
This guide catalogs those 20 procedures, organized by functional category, with an honest assessment of the migration complexity each one introduces. Use it to scope your migration effort, build realistic timelines, and understand why automated tooling — not manual rewriting — is the path to reliable conversion.
Data Manipulation Procedures
These are the procedures SAS programmers use most often to reshape, sort, merge, and transform data. They form the backbone of nearly every SAS program.
| SAS Procedure | Purpose | Complexity | Key Challenge |
|---|---|---|---|
PROC SORT |
Sort rows, remove duplicates | High | NODUPKEY deduplication semantics differ from SQL DISTINCT; which row is retained depends on implicit sort stability that modern engines do not guarantee |
PROC SQL |
SQL queries within SAS | Medium | SAS SQL dialect supports automatic remerging, implicit column resolution, and non-standard syntax that does not translate 1:1 to ANSI SQL |
PROC TRANSPOSE |
Pivot rows to columns | High | Interaction between ID, BY, and VAR statements creates reshape logic that is difficult to express correctly with a single pivot operation |
PROC APPEND |
Stack datasets vertically | Low | Column-name mismatches and type coercion that SAS handles silently must be explicitly managed in modern platforms |
PROC DATASETS |
Manage, rename, delete tables | Medium | Encompasses table renaming, label assignment, index management, and metadata operations — no single modern equivalent covers all uses |
PROC FORMAT |
Define value mappings / labels | High | SAS-specific concept with no direct parallel; formats are referenced across procedures, embedded in data views, and used for both display and computation |
Why Data Manipulation PROCs Are Deceptively Hard
Each of these procedures has behavioral nuances that go beyond simple syntax mapping. For example, PROC SORT with NODUPKEY behaves differently from SQL DISTINCT in ways that cause silent data errors if not handled correctly — the retained row depends on sort order and stability guarantees that SAS provides but modern distributed engines do not.
PROC FORMAT is particularly treacherous because formats are not just display logic — they are used computationally in PUT functions, WHERE clauses, and BY groups throughout an entire codebase. Missing even one format reference can cascade into incorrect results across dozens of downstream programs.

SAS — enterprise migration powered by MigryX
Statistical Procedures
SAS built its reputation on statistical computing. These procedures generate summary statistics, frequency distributions, and basic analytics.
| SAS Procedure | Purpose | Complexity | Key Challenge |
|---|---|---|---|
PROC MEANS |
Descriptive statistics (mean, std, min, max) | Medium | Output dataset structure with _TYPE_ and _FREQ_ variables, NWAY option semantics, and automatic variable selection require careful reconstruction |
PROC SUMMARY |
Similar to MEANS, class-level output | Medium | Subtle behavioral differences from PROC MEANS (NPRINT default, output dataset structure) cause confusion during migration; both must be handled correctly |
PROC FREQ |
Frequency tables, crosstabs, chi-square | Medium | Multi-way crosstabs, statistical tests (chi-square, Fisher exact), and output dataset formats have no single-function equivalent |
PROC UNIVARIATE |
Detailed distribution analysis, percentiles | High | Produces percentiles, normality tests, histograms, and extreme observations in a single call; exact vs. approximate percentile methods yield different results at scale |
PROC CORR |
Correlation matrix | Medium | Missing-value handling (pairwise vs. listwise deletion), partial correlations, and output dataset structure differ across platforms |
PROC REG |
Linear regression | High | Not just a model fit — includes diagnostic plots, collinearity statistics, stepwise selection, and output datasets that require a fundamentally different pipeline architecture |
Why Statistical PROCs Are a Migration Minefield
Statistical procedures are where SAS migrations most often produce results that look correct but are subtly wrong. PROC MEANS and PROC SUMMARY appear interchangeable in SAS, but their default behaviors around output datasets, class variable combinations, and the _TYPE_ variable differ in ways that downstream code depends on. Get it wrong and aggregation results silently change.
PROC UNIVARIATE is a single procedure that replaces an entire analytics workflow — percentile calculation, distribution testing, outlier detection, and histogram generation. Reproducing its exact output requires coordinating multiple tools and libraries, and the percentile algorithms themselves can produce different numbers depending on the interpolation method used.
Modeling procedures like PROC REG are not just code translation problems — they require rethinking the entire pipeline architecture, from data preparation through model diagnostics to scoring.
MigryX Compass: From Chaos to Clarity
Every enterprise migration starts with the same challenge: understanding what you actually have. MigryX Compass scans your entire legacy estate — SAS programs, ETL jobs, stored procedures, macro libraries — and delivers a complete dependency graph, complexity score for every asset, and a recommended migration wave plan. What takes consulting teams weeks of manual inventory work, MigryX Compass accomplishes in hours.
Reporting Procedures
SAS reporting procedures generate formatted output for human consumption — tables, listings, and printed reports.
| SAS Procedure | Purpose | Complexity | Key Challenge |
|---|---|---|---|
PROC PRINT |
Display data as a table | Low | Simple data display, but SAS-specific formatting (labels, formats, WHERE clause) must be stripped or re-implemented |
PROC REPORT |
Formatted summary reports | High | Combines data aggregation, conditional formatting, computed columns, and layout in a single procedure; requires architectural decision about where reporting logic belongs |
PROC TABULATE |
Multi-dimensional summary tables | High | Nested row/column dimension syntax with multiple statistics creates complex multi-dimensional outputs that are difficult to reproduce exactly |
PROC CONTENTS |
Dataset metadata (columns, types, row count) | Low | Straightforward metadata retrieval, but downstream code that parses PROC CONTENTS output datasets requires restructuring |
Why Reporting PROCs Force Architectural Decisions
Reporting procedures are where SAS migrations hit an architectural crossroads. In SAS, a single PROC REPORT call can aggregate data, compute derived columns, apply conditional formatting, and produce a finished report — all in one step. Modern platforms separate these concerns across data transformation, business logic, and presentation layers. Deciding where each piece of logic belongs is often harder than the code conversion itself.
PROC TABULATE presents a similar challenge: its nested dimension syntax produces multi-level summary tables that stakeholders have come to expect in a specific format. Reproducing the exact layout — not just the numbers — requires coordinating multiple tools and often significant stakeholder negotiation.
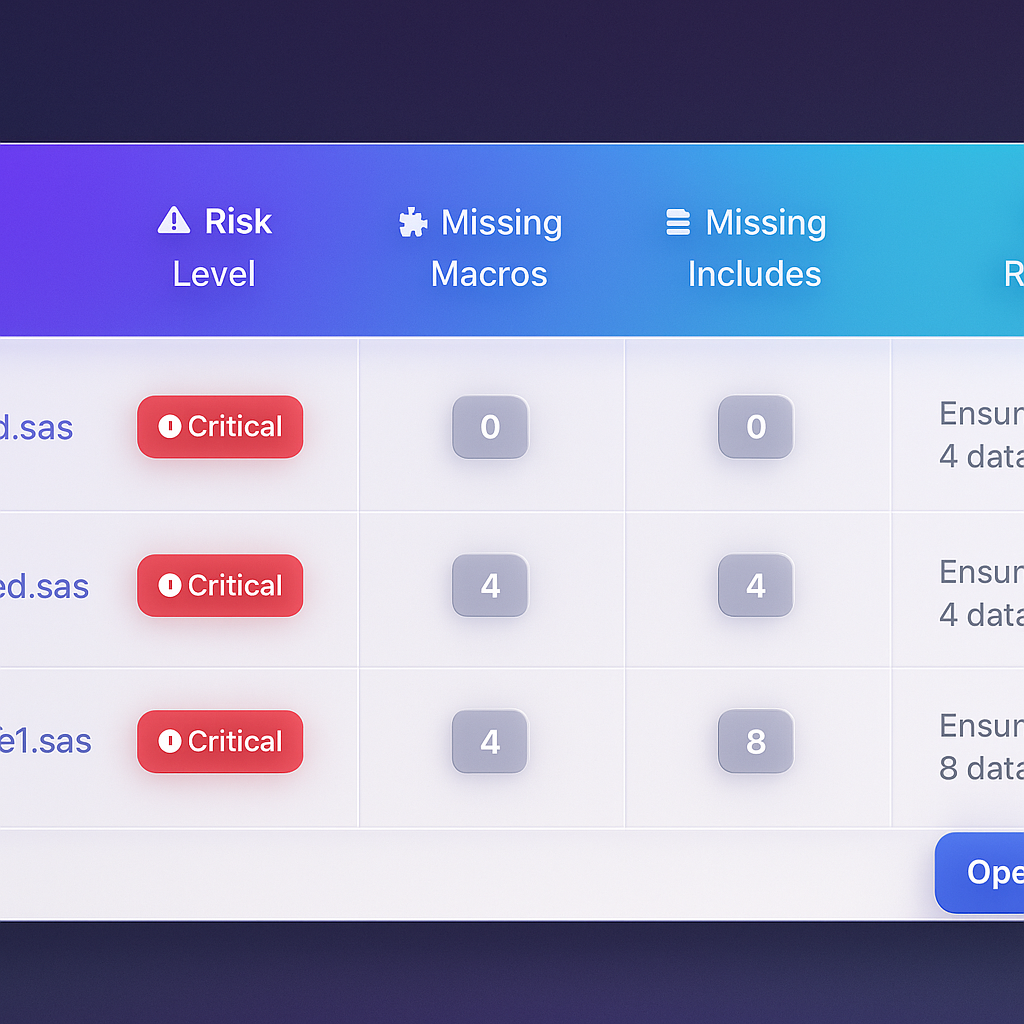
MigryX risk analysis identifies high-complexity programs and recommends optimal migration sequencing
Data-Driven Migration Planning with MigryX
MigryX does not just estimate complexity — it quantifies it. Every program receives a composite score based on lines of code, unique constructs, macro nesting depth, external dependencies, and data volume. Program managers use these scores to build realistic wave plans, allocate resources accurately, and set expectations with stakeholders based on data, not guesswork.
Utility Procedures
These procedures handle data import/export, file management, and system operations.
| SAS Procedure | Purpose | Complexity | Key Challenge |
|---|---|---|---|
PROC IMPORT |
Read CSV, Excel, etc. | Medium | SAS automatic type inference, delimiter guessing, and encoding handling behave differently from modern readers; schema mismatches surface late in testing |
PROC EXPORT |
Write to CSV, Excel, etc. | Low | Output file formatting (delimiters, quoting rules, date formats) must match downstream consumer expectations exactly |
PROC COMPARE |
Compare two datasets | Medium | Tolerance-based numeric comparison, variable-by-variable mismatch reporting, and ID-key matching logic are hard to replicate with simple set operations |
PROC PRINTTO |
Redirect log output | Low | Requires rethinking log management for cloud-native environments where file-based log routing does not apply |
Why Validation Is the Hardest Part
PROC COMPARE is indispensable during migration itself — you need to prove that converted code produces identical output. But replicating PROC COMPARE's tolerance-based comparison, variable-level mismatch reporting, and observation-matching logic is itself a non-trivial engineering challenge. Without robust validation tooling, teams spend more time proving correctness than performing the actual conversion.
The Complete Complexity Scorecard
Here are all 20 procedures scored by migration difficulty. The more stars, the more likely manual conversion will introduce subtle errors that pass initial testing but fail in production.
| # | SAS Procedure | Category | Complexity | Why It's Hard |
|---|---|---|---|---|
| 1 | PROC SORT | Data | ★★★★ | NODUPKEY semantics, sort stability, implicit variable selection — deduplication errors are silent and data-dependent |
| 2 | PROC SQL | Data | ★★★ | SAS SQL dialect auto-remerging, implicit columns, non-ANSI syntax require per-query analysis |
| 3 | PROC TRANSPOSE | Data | ★★★★ | ID/BY/VAR statement interactions produce reshape logic that is error-prone to reconstruct |
| 4 | PROC APPEND | Data | ★★ | Silent column-name and type coercion that SAS handles automatically must be managed explicitly |
| 5 | PROC DATASETS | Data | ★★★ | Multi-function procedure spanning DDL, metadata, and index operations with no single equivalent |
| 6 | PROC FORMAT | Data | ★★★★★ | SAS-unique concept referenced across entire codebases; used computationally, not just for display |
| 7 | PROC MEANS | Stats | ★★★ | Output dataset structure (_TYPE_, _FREQ_), NWAY semantics, automatic variable selection |
| 8 | PROC SUMMARY | Stats | ★★★ | Subtle behavioral differences from PROC MEANS that downstream code depends on |
| 9 | PROC FREQ | Stats | ★★★ | Multi-way crosstabs, embedded statistical tests, and structured output datasets |
| 10 | PROC UNIVARIATE | Stats | ★★★★ | Single procedure replacing an entire analytics workflow; exact vs. approximate percentiles diverge at scale |
| 11 | PROC CORR | Stats | ★★★ | Missing-value handling strategies and partial correlation support differ across platforms |
| 12 | PROC REG | Stats | ★★★★★ | Full pipeline (diagnostics, stepwise selection, output datasets) requires architectural redesign, not syntax mapping |
| 13 | PROC PRINT | Report | ★ | Simple display, but embedded labels, formats, and WHERE clauses need re-implementation |
| 14 | PROC REPORT | Report | ★★★★ | Aggregation + formatting + layout in one call; modern architecture separates these concerns |
| 15 | PROC TABULATE | Report | ★★★★ | Nested dimension syntax with multiple statistics produces complex outputs hard to reproduce exactly |
| 16 | PROC CONTENTS | Report | ★ | Metadata retrieval is straightforward, but output dataset parsing in downstream code requires restructuring |
| 17 | PROC IMPORT | Utility | ★★★ | Automatic type inference, delimiter guessing, and encoding handling differ across platforms |
| 18 | PROC EXPORT | Utility | ★★ | Output formatting (delimiters, quoting, date formats) must match downstream expectations exactly |
| 19 | PROC COMPARE | Utility | ★★★ | Tolerance-based comparison and variable-level mismatch reporting are hard to replicate with set operations |
| 20 | PROC PRINTTO | Utility | ★ | Requires rethinking log management for cloud-native environments |
MigryX Handles All 20 — Including the Edge Cases
MigryX handles all 20 of these procedures out of the box, including the edge cases and behavioral nuances that manual conversion typically misses. From PROC FORMAT's cross-program references to PROC SORT's deduplication semantics to PROC REG's diagnostic pipelines — every conversion is validated against SAS output automatically. See it in action — schedule a demo.
Prioritizing Your Migration
Not all procedures need to be migrated at once. Use this prioritization framework:
- Identify your high-frequency procedures first. Run a codebase scan to find which of these 20 PROCs appear most often. In most enterprises, PROC SORT, PROC SQL, PROC MEANS, and PROC PRINT dominate — but the distribution varies by industry and team.
- Assess complexity honestly. The 4- and 5-star procedures in the table above (PROC FORMAT, PROC REG, PROC SORT with NODUPKEY, PROC TRANSPOSE) are where manual conversion projects stall. Budget 3-5x more effort for these than their line count suggests.
- Plan for validation from day one. Every converted procedure needs output-level validation against SAS. Without automated comparison tooling, validation becomes the bottleneck — not the conversion itself.
Covering the top 10 procedures by frequency typically touches 80% of the code in a SAS codebase. But the remaining 20% — the 4- and 5-star procedures — is where 80% of the migration risk lives.
Understanding the scope and complexity of these 20 procedures is the first step toward a realistic migration plan. The challenge is not just translating syntax — it is preserving the behavioral semantics that your business logic depends on, across thousands of programs, without introducing silent errors.
Why MigryX Is the Foundation of Every Successful Migration
The challenges described throughout this article are exactly what MigryX was built to solve. Here is how MigryX transforms this process:
- Automated discovery: MigryX Compass scans thousands of programs and produces a complete inventory with dependency mapping in hours.
- Complexity scoring: Every asset is scored by code complexity, data volume, and business criticality — enabling precise effort estimation.
- Wave planning: MigryX recommends optimal migration waves based on dependencies, ensuring no pipeline breaks mid-migration.
- 4-8x faster delivery: Enterprises using MigryX consistently report migration timelines compressed from years to months.
MigryX combines precision AST parsing with Merlin AI to deliver 99% accurate, production-ready migration — turning what used to be a multi-year manual effort into a streamlined, validated process. See it in action.
Ready to modernize your legacy code?
See how MigryX automates migration with precision, speed, and trust.
Schedule a Demo